Introducing a New Dashboard Landing Experience
The New Landing Experience
The Meraki Dashboard is changing! If you opted in to early access of the new dashboard experience, you've already gotten a glimpse into the exciting future of Meraki cloud management.
The first big change you will notice is right after you log into the dashboard. The new organization summary page will help you identify which network requires immediate attention at a quick glance, which devices might be offline, and how to optimize your networks for best performance.
Device Health
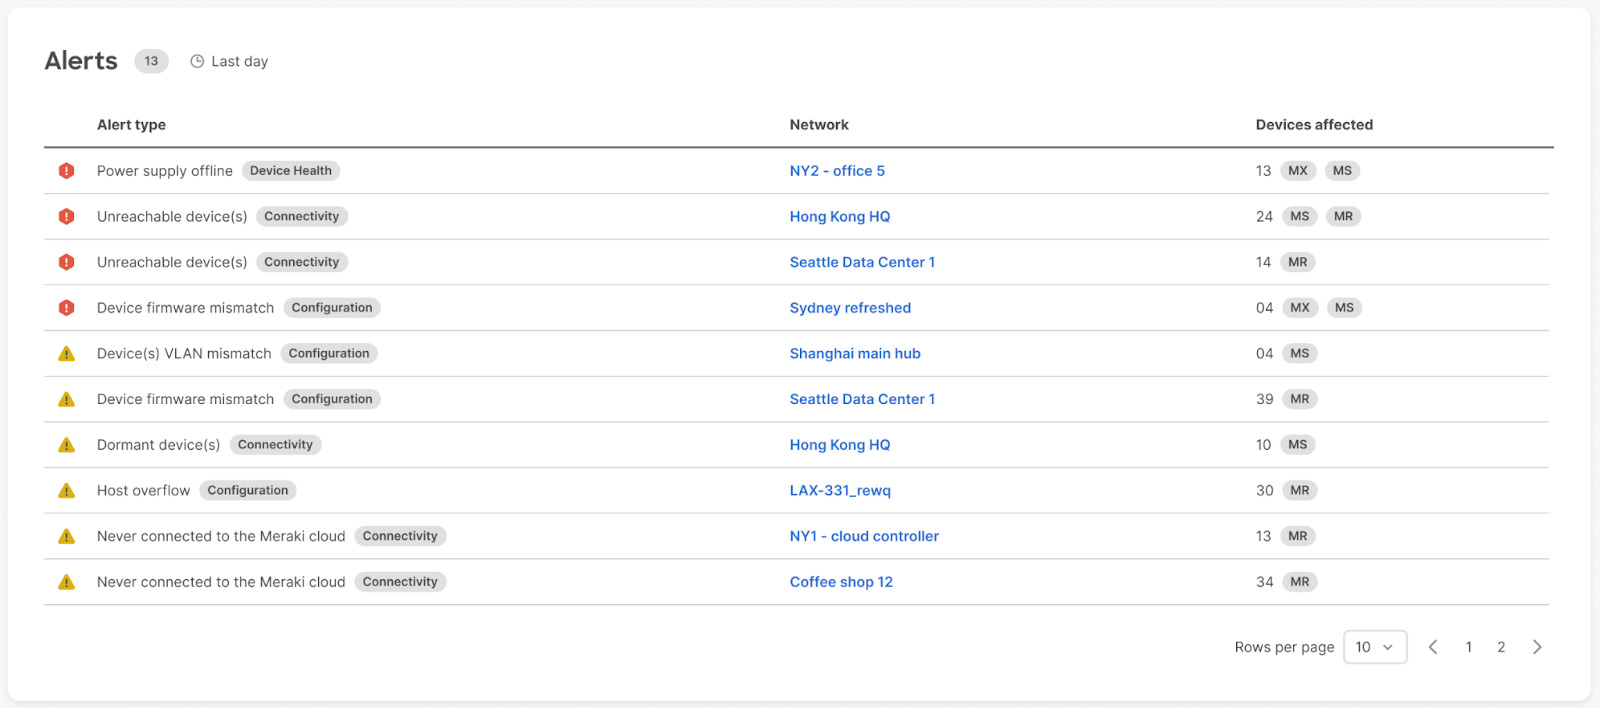
The dashboard's new device health rollups allow you to quickly inspect alerting devices that are grouped together based on the networks they're in. From here, an admin can quickly navigate to the network or directly to the device to troubleshoot.

Top Alerts
As we all know, there are a number of different things that can go wrong with a network, like clients unable to connect, security events, or suboptimal performance. Prioritized alerts and guided troubleshoot flows can help your team resolve this issues faster. In turn, you’ll free up time for more important things like optimizing network performance!

You can still opt in to experience these amazing changes! The Early Access page is available to admins in the navigation menu by going to Organization > Configure > Early Access.
Tell Meraki what you think—provide feedback using the feedback tool, which can be found on the right side of the screen once you opt in.
If you don’t currently run Meraki, you can always check out the new UI on their instant demo.


